


Scratch-Off Ticket Rankings
in the USA
Finding the right scratch-off ticket can be easier when you have useful data to compare. Scratch Ticket Genie provides scratch-off ticket rankings and information on ticket costs, Return on Investment (ROI), and ROI differences. Our data lets you compare games based on more than just their advertised prizes, giving you a clearer way to understand and evaluate available scratch-off ticket options.
 43 States + DC Available Data
 Ticket Rankings
 Accurate & Reliable — Official Lottery Data
About Scratch Ticket Genie
Scratch Ticket Genie provides free, publicly available scratch-off ticket data across 43 states and Washington, DC. Our goal is to make ticket information easier to understand and compare by providing detailed data, including current winning Return on Investment (ROI), ROI differences, and ticket costs. The information is intended for research and comparison purposes, helping visitors better understand the data associated with different scratch-off tickets.
Read More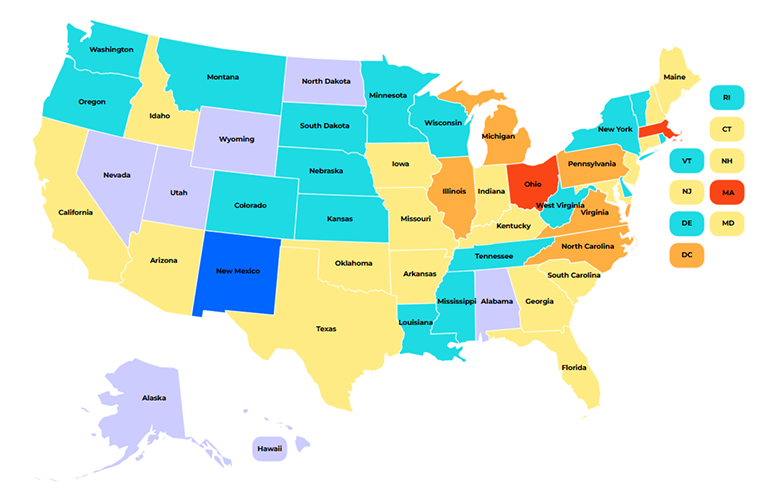
Three Free Tools To Explore
Scratch-Off Ticket Data
Explore Top 10 ROI Rankings, Newly Released Tickets, and Grand Prizes Remaining in one place, with current scratch-off ticket data including ROI, ticket prices, and remaining prizes to help you compare available games.
Top 10 ROI Rankings
The top 10 scratch-off tickets in your state ranked by current Return on Investment. Updated on a three-day cycle, so you're seeing recent data.
View ROI Rankings →Newly Released Tickets
New games mean fully intact prize pools. Track every scratch-off ticket in your state as soon as we find it in our update cycle.
View Newly Released →Grand Prizes Remaining
Check how many top prizes are still available on any active game before you buy. Updated from official state lottery sources.
Check Grand Prizes →
A Look At Different Scratch-Off Ticket Prices
Scratch Ticket Genie helps you understand and compare different scratch-off tickets across different price points, from $1 scratch-off tickets to $100 scratch-off tickets. We provide detailed information about scratch-off ticket rankings and odds, including ticket costs, current winning Return on Investment (ROI), and ROI differences, so you can easily compare how the available data represent different tickets.
How Our Scratch-Off Ticket Rankings Work
The rankings organize key ticket information in a simple format, making it easier to understand and compare available data.
State Selection
Pick your state from the list to pull up scratch-off ticket data specific to where you actually play.
Ticket Name
The name of each scratch-off ticket we track, so you know exactly which game the numbers belong to.
Initial Winning Return On Investment
The ticket's original winning ROI, calculated from the earliest data available when the game launched.
Current Winning Return On Investment
Where that winning ROI stands right now, updated as fresh data comes in.
Return On Investment Change
A look at how the ROI has moved between those two points, so you can see whether a ticket's odds have gotten better or worse over time.
Ticket Cost
View the listed price of each scratch-off ticket for an easy cost comparison.
Why Trust Scratch Ticket Genie
To bring you the best scratch-off ticket rankings, we go straight to the source: official state lottery websites. That way, you know what you're seeing is accurate, reliable, and transparent for every ticket we track. Our up-to-date statistics cover the metrics that actually matter, like prize availability and payout rates, so you have clearer information to review before you buy and can make a more informed decision.
.png)
Compare Low-Cost And High-Cost Scratch-Off Tickets
Scratch-off tickets come in all kinds of price points, so it's worth pausing to compare the different ticket types and see what the numbers really show.
$1 Scratch-Off Tickets
Review data for lower-cost scratch-off games, including their listed ticket price and available statistics.
$3 Scratch-Off Tickets
Review data for $3 scratch-off tickets, including listed ticket prices and current winning ROI.
$5 Scratch-Off Tickets
Explore data associated with $5 tickets, including winning ROI and other tracked metrics.
$10 Scratch-Off Tickets
Compare $10 scratch-off tickets using available information on costs, odds, and ROI.
$15 Scratch-Off Tickets
Explore data associated with $15 tickets, including winning ROI and other tracked metrics.
$20 Scratch-Off Tickets
Review data for $20 tickets and compare their tracked metrics with other price points.
$25 Scratch-Off Tickets
Compare $25 scratch-off tickets using available information on costs and ROI.
$30 Scratch-Off Tickets
Review data for $30 tickets and compare their tracked metrics with other price points.
$40 Scratch-Off Tickets
Explore available data for $40 scratch-off tickets, including current winning ROI and ROI changes.
$40 Scratch-Off Tickets
Explore available data for $40 scratch-off tickets, including current winning ROI and ROI changes.
$50 Scratch-Off Tickets
Explore available data for $50 scratch-off tickets, including current winning ROI and ROI changes.
$100 Scratch-Off Tickets
Review data for higher-priced $100 scratch-off tickets and compare their available statistics.

Why Compare Return On Investment Differences
Comparing ROI differences can add some helpful context as you dig into scratch-off ticket data. Looking at how the winning ROI has shifted from the start of a game to where it stands now gives you a better feel for how different tickets compare over time.
Frequently Asked Questions
Scratch-off ticket rankings and odds are organized using available data such as state, ticket name, initial winning ROI, current winning ROI, ROI change, and ticket cost.
Return on investment (ROI) compares the value of a ticket's prize payout against its total printed cost, showing what share of that money would come back as prizes.
Scratch-off ticket prices vary by game and by state, running the gamut from budget-friendly $1 tickets all the way up to $50 and $100 tickets on the higher end.
Yes, the available scratch-off ticket data is provided free to the public across 43 states and Washington, DC.
Explore Scratch-Off Ticket Rankings And Odds
Explore scratch-off ticket rankings and odds with detailed data on ticket costs, current winning Return on Investment (ROI), and ROI differences. Scratch Ticket Genie makes this information easy to review and compare in one place.
Select Your State To Get StartedContact Scratch Ticket Genie
Questions, feedback, or need more information? We'd love to hear from you.