See how the top 10 scratch-off tickets in your state rank by current Return on Investment.
Scratch-off tickets are not all the same, and the difference is not always visible on the ticket itself. Two tickets at the same price can have very different prize structures, and those structures shift as prizes get claimed. Scratch Ticket Genie ranks the top 10 scratch-off tickets in every state by current Return on Investment, using data taken from official state lottery sources. Free to view, no account needed.
Use the color guide below to see where your state stands, then explore the map.
Hottest Top 10 Scratchers in the Country.
Above average Top 10 Scratchers in the Country.
Average Top 10 Scratchers in the Country.
Below average Top 10 Scratchers in the Country.
Coldest Top 10 Scratchers in the Country.
The state currently does not have Scratchers for sale. Please alert scratchticketgenie@gmail.com once Scratch Tickets become available in the States.
Select your state to see its current top 10 scratch-off tickets, along with ticket cost, initial ROI, current ROI, and how far the ROI has moved since the ticket launched.
Each ticket in the top 10 lists the following:
The name the state lottery uses for that scratch-off ticket, with a direct link to its page on the official state lottery site so you can check the figures at the source.
The listed price of the ticket, which is useful context when comparing the ROI across price points.
The ticket's winning Return on Investment calculated from the prize structure published when the ticket was released.
Where that figure stands now, based on the prizes the state lottery currently reports as still available.
The difference between the initial and current figure. This is often the most useful number of the five, because it shows the direction a ticket has moved rather than a single snapshot.
Return on Investment is the metric the top 10 is ranked by, so it is worth explaining what it measures. Every scratch-off ticket is published with three figures: how many tickets were printed, what each ticket costs, and the total value of the prize pool. Those three numbers are what the calculation starts from.
The initial ROI compares the full prize pool against the total cost of every ticket printed. In plain terms, it answers a simple question: if every ticket in the run were bought, what share of that money would come back as prizes? This figure is fixed at release and does not change.
As tickets sell and prizes are claimed, both sides of that comparison shrink. The current ROI compares the prize pool that is still unclaimed against the cost of the tickets still in circulation. It answers the same question as the initial ROI, but for the portion of the run that is still on shelves rather than the run as a whole.
The change is the gap between those two figures, and it is usually the more useful number. It shows the direction a ticket has moved since release rather than a single point in time.
A current ROI above the initial figure means larger prizes have gone unclaimed at a rate faster than tickets have sold. More of the prize pool remains than the ticket's position in its run would suggest.
A current ROI below the initial figure means larger prizes were claimed early relative to the tickets still in circulation. The ticket stays on sale at the same price, but the prizes that shaped its original structure have largely gone.
Neither direction changes the outcome of any individual ticket. It describes what is left in the prize pool, nothing more.

Major prizes are not always claimed straight away. Many winners seek legal or financial advice before coming forward, and weeks can pass before a win is officially recorded by the state lottery.
If that delay is ignored, a ticket looks better than it is, because the published data still lists a prize that has effectively already been won. We account for this reporting lag in our calculation so the current ROI is never falsely inflated by prizes that are gone in practice.
.png)
Not every state publishes its scratch-off data in the same format, and some release far less than others. For those states the calculation has to be worked out from what is available rather than taken directly. That work is done in-house and the resulting method is our own, but the underlying figures still come from official state lottery sources in every case.
A top 10 ranking is not fixed. Tickets move up and down, and sometimes drop off entirely. There are three main reasons.

Every claimed prize changes what is left in the ticket's prize pool. When high-value prizes are claimed early, the current ROI falls. When they stay unclaimed while the ticket continues selling, the current ROI rises.
.png)
States release new scratch-off tickets throughout the year. A newly released ticket enters with its full prize structure intact, which often places it high in the ranking on release.
.png)
State lotteries end tickets and pull them from sale, at which point they leave the ranking entirely.
Every figure on this page traces back to official state lottery sources. We do not use third-party data or carry numbers over from other sites.
Each ticket links directly to its state lottery page, so any number here can be checked at the source. If a figure cannot be verified against official published data, it does not go on the site.
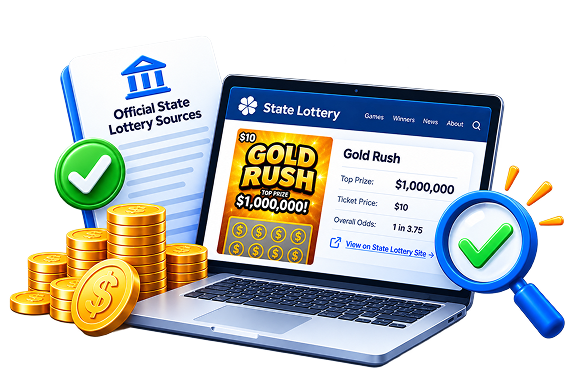

We update on a three-day cycle, covering roughly fifteen states per day. Any ranking you see here is at most three days old.
Newly released tickets are the exception. We check every state for new releases first and add them as soon as we find them, because a new ticket carries the largest gap between what is published and what most people know.
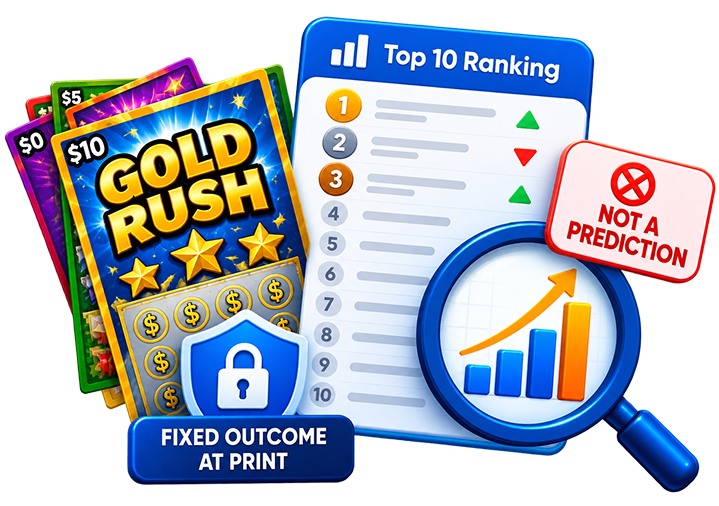
This site is an information tool. It is not a prediction and it does not tell you what to buy.
A higher current ROI does not mean a ticket is more likely to win. It means that the prizes that are left in the game, relative to the tickets that are left to be sold, are a larger share of the total cost.
The ranking does not show how the published prize structure of a game compares to the actual prizes that have been claimed. It only shows the published information that is easy to compare.
Current winning Return on Investment, calculated from the prize data each state lottery publishes for that ticket.
Return on Investment (ROI) compares the value of a ticket's prize pool against its total printed cost, showing what share of that money would come back as prizes.
The rankings are updated every three days on a rolling cycle of about fifteen states per day. Individual positions can shift whenever prizes are claimed or new tickets launch.
No. The ranking compares published prize data across tickets. No ranking can indicate that a specific ticket will win.
Scratch-off tickets are issued separately by each state lottery, with their own prize structures, price points and odds. A national ranking would compare tickets that are not available to the same people.
Official state lottery sources. Every ticket links back to its source page.
Yes. All 43 states and Washington, DC, with no subscription or account required.
Scratch-off tickets are entertainment, not a way to make money. You must be 18 or older to purchase. If gambling is causing problems, Call 1-800-GAMBLER (1-800-426-2537).

Select your state above to view its current top 10 scratch-off tickets, with ticket cost, initial ROI, current ROI and ROI change for each. Free, no signup, updated every three days.
Select Your State